
 Odoo
Odoo How Odoo Is Transforming Supermarkets in Uzbekistan: A Real Case Study
If you run a supermarket or grocery store in Uzbekistan, and you want transparency, control, and growth — Odoo is the sy...
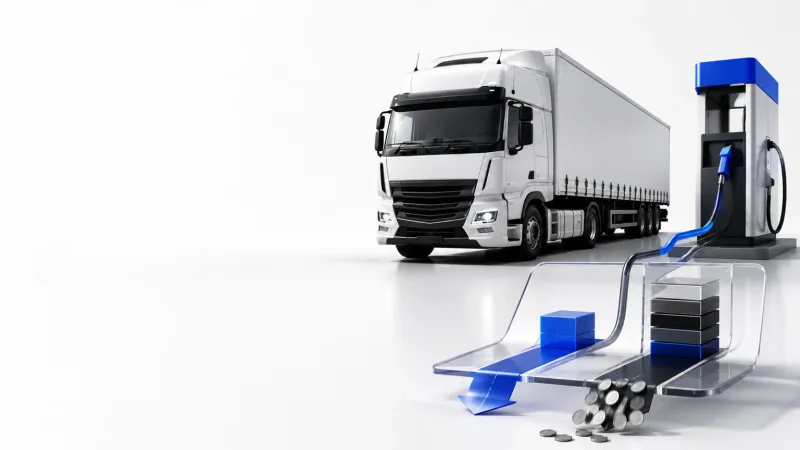
Trip margin is order revenue minus all costs attributable to the trip, including an empty return. Calculating it in Odoo requires a trip identifier and rules connecting revenue and expenses. GPS data alone does not show profitability.
The question should be asked differently: which trip cost more than it earned? Odoo ERP assigns a separate analytical account to each run and reveals that gap. The system connects order revenue with diesel, driver pay, repairs, depreciation, and empty-return costs. The manager can then see that the Tashkent–Samarkand route is profitable, while the rate for the Tashkent–Karshi route needs to be recalculated.
We often see the same mistake in fleet operations: liters and kilometers are monitored, but trip margins are not calculated. The margin of every trip must be calculated. Otherwise, a small increase in diesel prices can turn into a substantial loss within just a few months.
Every amount below is illustrative. These are not customer results, market rates or a Celion quotation.
| Item | Amount, UZS |
|---|---|
| Order revenue | 5,200,000 |
| Diesel | −2,150,000 |
| Driver expenses | −750,000 |
| Repair allocation | −520,000 |
| Depreciation | −680,000 |
| Margin before empty return | 1,100,000 |
| Empty return | −1,350,000 |
| Final margin | −250,000 |
Eight trips with the same economics: −250,000 × 8 = −2,000,000 UZS. Verify the cost allocation before judging a rate or a driver.
| Data | Source / rule |
|---|---|
| Trip ID | The same identifier across order, vehicle and expenses |
| Revenue | Order or invoice; prevent double counting |
| Diesel | Litres × actual purchase price; assign to the trip |
| Repairs and depreciation | Allocate using agreed mileage or period rules |
| Empty return | Define which order/trip absorbs its costs |
| Reconciliation | Reconcile trip totals with the accounting records |
Fleet records vehicles and related costs. Analytic accounting helps separate costs. The trip-ID model, GPS/fuel imports, allocations and alerts may require configuration or custom development; installing a module does not deliver this model automatically.
Sources: Odoo 19: Fleet · Odoo 19: Analytic accounting
Many companies have a fuel spreadsheet listing the vehicle, date, liters, and driver. The spreadsheet records consumption, but it does not tell you whether that consumption was justified. The same 300 liters of diesel may generate a profit on an urgent, high-value order. On a low-rate trip followed by an empty return, however, that same consumption can push the company into the red.
Golden Pages listings show that filling station prices vary across Tashkent. That is why the system should record not a standard estimate, but the actual price paid per liter and the specific trip on which the fuel was used.
If you count only fuel, the report may show a profit. But the money will not remain in the account.
01
The liters purchased, the price paid, and actual consumption on the route.
02
Kilometers traveled without cargo on the return journey are also included in the order’s cost.
03
Trip pay, daily allowances, and additional payments are allocated to the relevant run.
04
The cost of tires, oil, and spare parts is assigned to the relevant vehicle.
05
The vehicle’s depreciation cost is allocated by mileage or accounting period.
06
Penalties and downtime are deducted from the trip margin.
Let’s look at a hypothetical calculation. A customer paid 5.2 million soums for a Tashkent–Karshi trip. Diesel cost 2.15 million soums, driver expenses were 750 thousand soums, the share of repair costs was 520 thousand soums, and depreciation came to 680 thousand soums. If the calculation stops there, the trip appears to have generated a profit of 1.1 million soums.
But the truck returned empty from Karshi. The return journey alone cost another 1.35 million soums. The trip’s actual result was a loss of 250 thousand soums. If the same run is repeated eight times a month, the company loses two million soums even though its trucks remain busy.
Warning
GPS shows where a vehicle traveled and how much distance it covered. If that data is not connected to financial accounting, you cannot tell whether the trip made or lost money for the company.
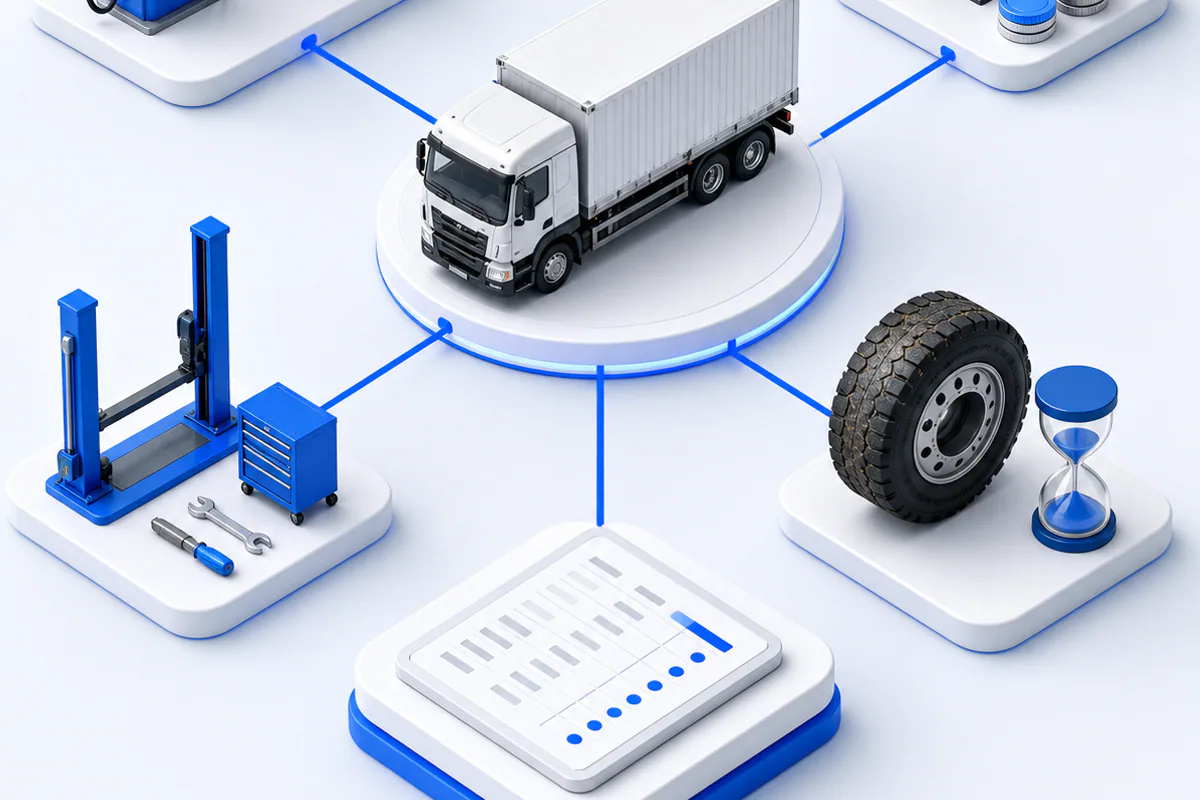
Full trip cost includes diesel, driver pay, repairs, depreciation and the empty return.
According to the Odoo 19 documentation, the Fleet module tracks vehicles, contracts, and service costs. Analytic Accounting makes it possible to separate these costs by route or trip. We recommend structuring each run as a separate analytical object. This makes fleet accounting traceable and verifiable.
Revenue comes from the sales order. Data from a fuel card or GPS system is assigned to the relevant trip through an API. Purchase and accounting entries then add repair costs. The final report breaks down the trip margin by vehicle, driver, customer, or route.
Do not rush to build a large dashboard. First, calculate the economics of a single trip correctly.
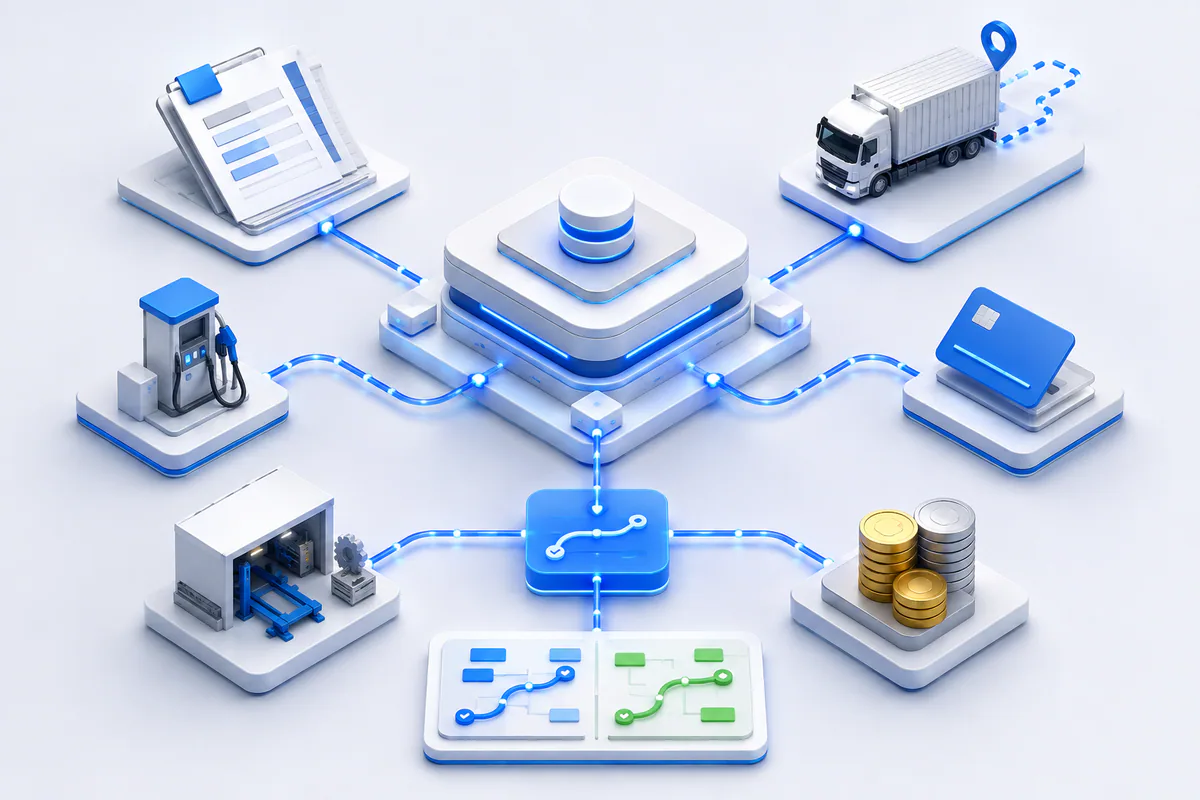
Unified analytics connects order revenue with every expense of the specific trip.
A beautiful chart does not save money. A useful report clearly separates the causes of a loss: is the rate too low, is diesel consumption above the standard, or did the truck return without cargo? If the cause is unclear, the manager is likely to make the wrong decision.
If the rate is too low, pricing is renegotiated with the customer. If there is too much empty mileage, return loads are planned in advance. If the problem keeps recurring with one vehicle, the company can consider a technical inspection or replacement. An Odoo report should show not only the problem, but also the next task and the person responsible for it.
A busy truck is not always a profitable truck.
Celion engineering team
Some companies start connecting GPS, fuel cards, accounting, and a mobile app in the very first week. The volume of data grows, but no useful report comes out of it. The reason is simple: the same trip number is recorded differently across different systems.
Agree on the economic model first. When does a trip begin and end? Which order should absorb the cost of an empty return? How should overhead costs be allocated? Without one clear answer to each of these questions, automation will only multiply accounting errors faster.
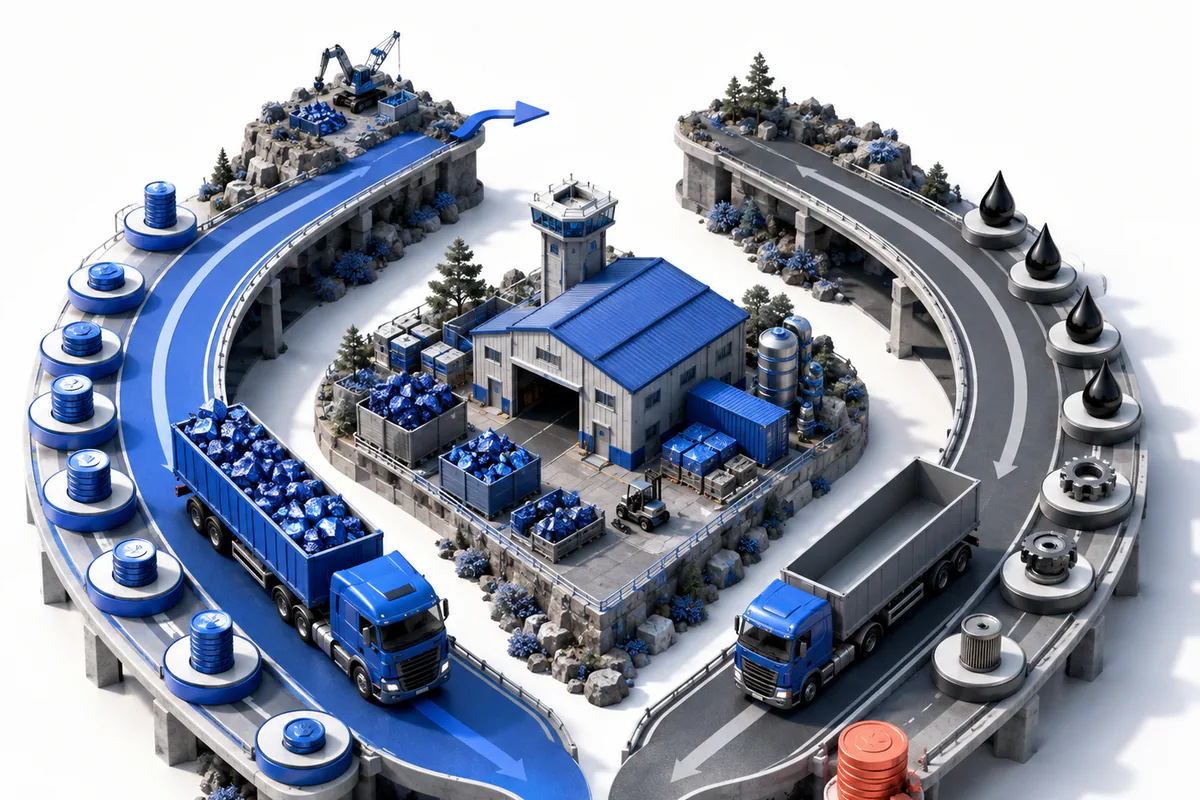
An empty return leg can turn strong trip revenue into an actual loss.
A fleet report should clearly show the following results:
Does Odoo replace a GPS tracking system?
No. GPS collects location, distance, speed, and, on some devices, fuel readings. Odoo connects this data with orders, invoices, and expenses. When the two systems are connected through an API, GPS shows vehicle movement, while Odoo shows the financial result of that movement.
Does a small fleet of 10 to 20 vehicles need Odoo?
Yes, if the company works with multiple routes, customers, and rates. The issue is not the number of vehicles, but which trip each cost is assigned to. A small fleet can start with a compact accounting model covering the trip, revenue, diesel, driver pay, and repair costs. That information alone can reveal where losses are emerging.
Can fuel data be entered manually?
Yes, during the initial stage. An operator can enter the liters, price, and vehicle from a receipt or fuel card report. Once the calculation has been tested on several actual trips, data entry can be automated through an API or file import. Testing the model manually first is cheaper than automating an incorrect model.
Should a loss-making route be closed?
Not immediately. First, identify the source of the loss. The cause may be a low rate, an empty return, excessive fuel consumption, or a vehicle that requires frequent repairs. Sometimes increasing the rate by 5% to 7% is enough. In other cases, finding a return load or replacing the vehicle may be more profitable.
The Celion team connects Odoo ERP, GPS, and accounting systems to calculate the true profitability of every trip. We begin with actual data from a single route. Once the calculation has been verified, we build a management dashboard and AI-based cost forecasting. Contact us.
Callback
Leave your details and we will contact you shortly.
Become a Partner
Leave your contact details and we will get back to you shortly.
Order Service
Leave your phone number and we will contact you shortly.